
Regulatory and cost drivers have increased the focus on rinsewater reduction at the Boeing Plant in Auburn, Washington.
 W. John FullenThe first step in making reductions is to determine the amount of rinsewater required for a given process, taking into account requirements driven by health and safety, applicable specifications and part quality.
This can be accomplished with the Rinsewater Reduction Calculator (RRC), which uses a Microsoft Access database to model single, double counter current, and triple counter current rinse tanks.
Implementing timer settings generated with the RRC in place of subjective practices has reduced rinsewater usage by more than 50%.
Introduction
In a tankline that uses double counter current rinses (DCCR), two-thirds of the tanks contain rinsewater, which for purchase, treatment and discharge, costs around 2 cents per gallon. Even at that relatively low rate, the monetary savings are substantial when achievable reductions are in the millions of gallons. It is well known that most facilities use more water than necessary and reductions would provide significant environmental and economic benefit1,2,3. The first step in making reductions is to determine the amount of rinsewater required for a given process, taking into account requirements driven by health and safety, applicable specifications and part quality4. Aside from general inflation, the future cost of water might be influenced by fluctuating water supply, regional growth, salmon habitat protection and water de-regulation.
Mathematical models5 were previously developed to determine the volume of water required to manage the levels and concentrations of single, double counter-current (DCCR) and triple counter-current (TCCR) immersion rinses. These models account for changes in rinsewater levels and concentrations due to process solution dragin, rinsewater dragout and evaporative losses. The Rinsewater Reduction Calculator (RRC), a Microsoft Access database, is used to adapt these mathematical models to real life applications. Although the mathematical models are briefly presented here, the focus of this paper is on the use of the RRC, located at https://www.boeingsuppliers.com/environmental/RCC_Index.html
Mathematical Modeling
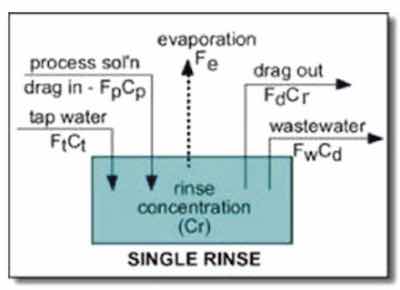 Figure 1. Model of Single RinseSingle Rinse Model
Figure 1 illustrates the model for a single immersion rinse, the simplest of the three designs modeled and the most inefficient. A mass balance performed over the rinse results in the following steady-state general solution:
Ft = (Fp (Cr - Cp) – FeCr)/(Ct – Cr) (1)
The variables in the above equation are flow rate (F) and concentration (C) and are used along with the following subscripts: d (dragout) p (process solution) t (makeup water) e (evaporation) r (rinsewater) w (wastewater
DCCR Model
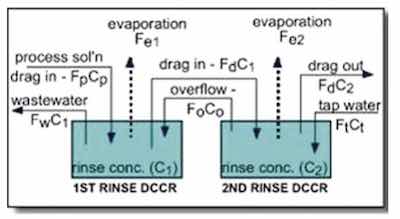 Figure 2. Model of DCCRFigure 2 depicts the model for a DCCR, which is the most commonly used design and substantially more efficient than a single rinse. A mass balance performed over the DCCR results in a complex quadratic equation, with the following simplified solution:
Ft = [(FdFpCp)/(C2-Ct)]1/2 (2)
Equation (2) is similar to that found in other publications6, but if used, results in a loss of precision and accuracy. The RRC uses the complex quadratic equation without simplifying assumptions.
TCCR Model
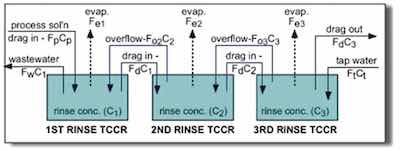 Figure 3. Model of TCCR (triple counter current rinse tank)This design (figure 3) is rarely used because the first rinse becomes highly concentrated, which can have a deleterious impact on the process, equipment or wastewater pretreatment plant. If there are restrictions on the concentration of the first rinse, a TCCR might use more water than a DCCR. For a TCCR, linear matrix algebra is required to simultaneously solve the mass balance equations around each of the rinses. To achieve the desired rinse concentration, the makeup water flow rate (Ft) is determined by iterating the volume of water required per load.
Rinsewater Reduction Calculator
Purpose
The RRC can be used to determine the amount of water required to properly maintain the levels and concentrations of a given rinse tank and the length of time it takes to add the water if the water is only added when a load is processed. It is designed for applications where a timer is used to control the addition of water to a rinse tank. The timers are programmed with settings obtained from the RRC (sec/load or min/load), and tankline operators are trained to press the timer button each time a load is processed. Strictly controlling the amount of water added to the rinse tanks in this manner results in more efficient rinsewater management.
Additionally, the RRC can be used to compare the efficiencies of a single rinse, DCCR and TCCR. The impact of process parameters on water usage can also be evaluated (e.g., rinse temperature, loads per day, air agitation level, water quality, etc.).
Getting Started
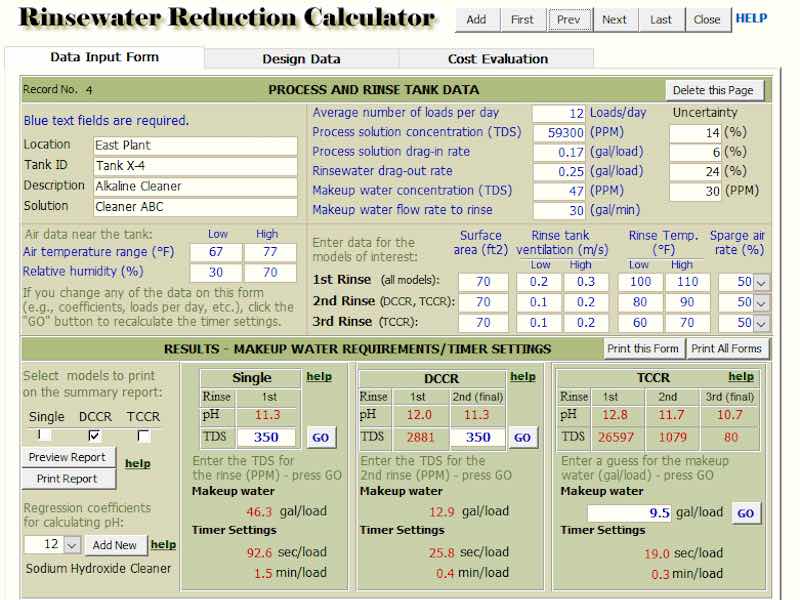
 Figure 4: RRC Data Input FormFigure 4 shows the RRC Data Input Form. The major sections are labeled in the figure and discussed below. Text fields labeled with blue-colored text are required.
Section 1. Data in this section are used to identify the process (e.g., location, tank number). All information in this section is optional.
Section 2. Regression coefficients, which are solution specific and used for calculating rinsewater pH, are chosen from a dropdown menu. If a representative solution is not available, choose “none” from the dropdown menu. Coefficients for additional solutions can be added by clicking the “Add New” button. The coefficients for the solutions were calculated using laboratory data, while those for the pure acids were calculated using published dissociation constants. For the solutions, the concentration (TDS) and pH of a series of sequentially diluted process solutions were measured and graphed. A linear regression analysis was performed to derive the regression coefficients (slope, intercept), which are used in the following equation in the RRC to calculate pH: pH = slope x ln[TDS] + intercept (3). TDS is the concentration of total dissolved solids in units of PPM (parts per million).
Section 3. The data in section 3 are required and include average number of part loads processed per day (e.g., baskets or racks of parts), air temperature and relative humidity. Default values are provided for the air temperature (67°F-77°F) and relative humidity (30%-70%).
Section 4. The following data are required: process solution concentration (TDS) and dragin rate (gal/load), rinsewater dragout rate (gal/load), and makeup water concentration (TDS) and flow rate (gal/min). The uncertainty data are used in the single rinse and DCCR models and are optional. The uncertainties should reflect your confidence in the data. If uncertainties are used, a safety factor will be added to the timer settings.
Section 5. These parameters are properties of the rinses and are used to calculate evaporative losses. The following are required: surface area (ft2), ventilation rate (m/sec), temperature (°F) and level of air agitation. Evaporative losses are usually significant for heated tanks and can also be important if the process solution concentration is low. If only room ventilation is available, the range 0.1 – 0.2 m/sec can be used as an approximation for ambient air movement and is the default. Rinse tank air agitation is described by one of the following levels and is selected from a dropdown menu: no-air, bubbling, moderate, or rolling. Since air sparging increases the evaporation rate, the evaporation rate is multiplied by a preset factor based on the level chosen7.
Section 6. In this section, indicate the models that will be evaluated by checking the applicable boxes. A report summarizing the timer settings can be printed out from this section. For a model to appear on the report, its box must be checked.
Section 7. Single Rinse Design: To apply this model, enter the desired or target TDS for the clean rinse, which is usually controlled by the governing process specification. Press the “GO” button, and the timer settings are calculated. (You can also press the enter key twice.) In figure 5, at a TDS of 350 PPM, the pH of the single rinse is shown as 11.3. The pH will only be calculated and displayed if regression coefficients are selected. Approximately 203 gallons of water need to be added to the single rinse each time a load is processed to maintain the proper level and concentration of that rinse. The makeup water flow rate is used to calculate a timer setting 9.2 min/load, as shown in figure 5.
Section 8. DCCR Design: To apply this model, enter a target TDS for the second rinse as shown in figure 6. Click the “GO” button or press the enter key twice. If regression coefficients are chosen, the pH of both rinses will be displayed as shown in the figure. If the TDS of the first rinse is too high, as is the case for some processes, decrease the target TDS until the first rinse TDS and pH are acceptable. Physically, the TDS of the first rinse cannot be less than the makeup water TDS or more than the process solution TDS. For the DCCR model, 9.3 gallons need to be added each time a load is processed, which is substantially less than the 203 gallons needed for a single rinse. The timer setting is 25.5 seconds per load.
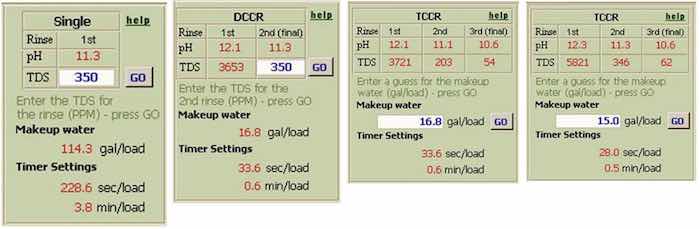 Figure 5. Single Rinse; Figure 6. DCCR Results; Figure 7. TCCR Results; and Figure 8. TCCR Results.
Section 9. TCCR Design: To apply this model, a value is entered for the gallons of makeup water required per load, and the “GO” button is pressed. Run the DCCR model first and use the value obtained from that model as a starting point. For example, start with 9.2 gallons per load from the DCCR model (figure 6) and iterate downward until the TDS of the rinses are acceptable.
The target TDS of 350 PPM can’t be attained because the TDS of the first rinse is higher than that of the processing solution. Even with a TDS of 298, the TDS of the first rinse approaches that of the processing solution (53900 PPM) and could be deleterious to the parts or equipment.
 Figure 9. Design Tab displaying Intermediate CalculationsSlightly increasing the makeup water to 8.9 gallons per load dramatically decreases the first rinse TDS. It is important to understand how sensitive the process is if a high concentration in the first rinse is impacting.
A comparison of the three models depicted in figures 5-8 shows the DCCR provides substantial water savings over the single rinse, while the TCCR provides meager savings over the DCCR. If the first and second rinses of a TCCR are controlling (e.g., pH limitations) or heated, it is likely that a TCCR will use more water than a DCCR.
Design Data – Intermediate Calculations
The second tab on the RRC Data Input Form displays the values of intermediate calculations, as shown in figure 9. These values aren’t stored but can be reproduced by pressing the “GO” buttons for the models.
The intermediate calculations are explained in detail in the help file that accompanies the RRC.
Application of the RRC: A Case Study
The following fictitious example is presented to give the user a better understanding of how to use the RRC.
The XYZ Chemical Company would like to reduce its water usage but has almost no capital budget to spend on equipment. As a first step, the process engineer has decided to use the RRC to determine how much water is actually needed to maintain the concentrations and levels of the currently installed DCCR tanks within company specifications. The process engineer will collect data and fill out a RRC Data Input Form for each process in the tankline. The form can be printed out for use in data collection in the field.
The XYZ Chemical Company has a chemical laboratory (Chem Lab), which performs analytical testing and can provide some of the data required by the RRC. Currently, water is added to maintain a clean appearance in the DCCR tanks. And, according to Chem Lab records, the TDS in the rinse tanks never approaches the maximum values allowed in the specification.
Filling out the RRC Data Input Form
The first tank in the tankline is a sodium hydroxide based cleaner. The outline below describes how the RRC Data Input Form should be filled out for this process:
1. The location, ID, description and solution name are entered on the form.
2. Next, regression coefficients are chosen, so the pH of the rinses can be calculated for feedback. There is a sodium hydroxide cleaner in the dropdown menu, so it is selected.
3. The average number of loads per day is 15.
4. The air temperature (°F) is the average range throughout the year or just the season of interest. In this case, the default values are used.
5. Humidity has an inverse relation with evaporation. Low humidity will result in a higher evaporation rate than a high humidity. The default values are used.
6. The process solution concentration must be calculated in PPM, so the quantity of chemicals dragged over to the first rinse can be determined. The Chem Lab records contain the concentrations (oz/gal) of the sodium hydroxide cleaner for the last 14 months: 8.3, 8.1, 8.2, 8.4, 8.2, 8.9, 9.2, 8.8, 9.7, 9.2, 9.5, 9.0, 8.9, and 7.6. The average concentration of the cleaner over this time period is 8.7 oz/gal with a sample standard deviation of 0.6. The MSDS lists the specific gravity of the cleaner as 1.1. The concentration of the process solution can now be calculated:
Process Solution Concentration = (8.7 oz / gal) x [lb / 16 oz (1.1)] x (gal / 8.345 lb) x 1,000,000 = 59,300 PPM (4)
7. The uncertainty of the process solution concentration is not required, but can be used to provide a safeguard in the calculation of the timer setting. A common engineering statistic for uncertainty analysis is two times the sample standard deviation. The uncertainty is calculated by the equation below:
Uncertainty = (2 x 0.6 / 8.7) x 100 = 13.8% (5)
8. Process solution dragin and rinsewater dragout are somewhat difficult to measure. Several methods can be used: gravimetric, tracer element and conductivity. The last two involve comparing dilutions of the process solution to minor changes measured in a stagnant rinse tank. These two methods involve extensive lab work and inevitably result in large uncertainties. It is more accurate to weigh a representative load when it’s wet, weigh it again when it's dry and then subtract the dry weight from the wet weight. The difference is either the process solution dragin or the rinsewater dragout, depending on which one is being measured. Multiple measurements are made and then averaged to obtain the values for dragin, dragout and standard deviations. For the sodium hydroxide based cleaner, the average dragin rate is measured at 0.12 gal/load, while the average dragout rate of the rinsewater is measured at 0.23 gal/load. You would expect liquids with similar rheology to have nearly equivalent dragin and dragout values. This is the case with acids and water but not necessarily with soap or other alkaline solutions. The rheology of an alkaline cleaner is much different than that of water, which results in more dragout of rinsewater than dragin of process solution. Expect fairly large uncertainty values because even measured dragout values will vary significantly. The uncertainties are calculated as before and are 6% for the process solution and 24% for the rinsewater (actual data is not given here for brevity).
9. The average makeup water concentration is calculated in the same manner as the concentration of the process solution, using Chem Lab data. The result here is 47 PPM. The uncertainty can be calculated or can be chosen. Based on the known fluctuation of the makeup water concentration, 30 PPM is used for the uncertainty in this example.
10. The makeup water flow rate can be determined by installing a meter on the incoming water line, or more simply, by dropping the level of the rinse tank and timing how long it takes to fill it back up again. The rinse tank for the sodium hydroxide cleaner has a length of 240 inches and a width of 42 inches. It takes 8 minutes for the water to rise 4 inches in the tank. The makeup water flow rate is calculated to be 22 gal/min as follows:
(240in) x (42in) x (4in / 8 min) x (ft3 / 1728 in3) x (7.47gal / ft3 min) = 22 gal (6)
11. Surface area is calculated to be 70 ft2 based on the dimensions above.
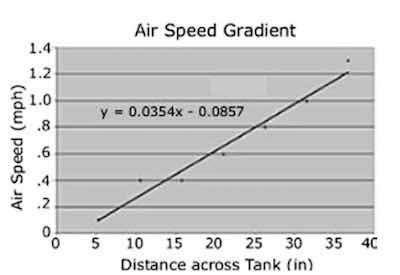 Figure 10. Graph of data obtained with a vane anemometer12. Average air speed across the surface of the tank (m/s) - If the tank isn’t ventilated, a default value of 0.1-0.2 m/sec can be used to represent ambient air movement. If forced-air ventilation is used, the air speed can be measured across the width of the tank with a vane anemometer and graphed as a function of tank width, as shown in figure 10. The resulting equation can then be integrated, using the first and last data points for the limits, and then divided by the entire tank width (42in). The above equation is often more complicated than a simple linear expression. It is recommended that the range be determined by adding + 0.05 to the calculated air speed. The range for the air speed is then 0.22 m/sec + 0.05 or 0.17-0.27 m/sec.
![]()
13. The rinse tank temperature should be measured 2-3 inches beneath the surface and, in this case, ranges from 60°F to 70°F.
14. A moderate level of air sparging is selected.
Getting the Results
The company specification allows the final rinse to have a maximum TDS of 350 PPM. So, 350 is entered for the target TDS for the DCCR model, and the “GO” button is pressed. The results are as follows: 4.8 gallons of water per load of makeup water are required and a timer setting of about 13 seconds. The timer on the rinse tank will have to be reset to the new setting, and the operator will have to be trained to press the button each time a load is processed. The timer setting generated by the RRC is a starting point and may have to be adjusted either up or down based on process performance.
A single rinse and a TCCR can also be evaluated for this application. The RRC Data Input Form with the results of this case study is shown in figure 11.
Implementation
To date, seven tanklines at the Boeing plant in Auburn, WA are using timer settings generated by the RRC to manage their water usage. The tanks in these lines range in volume from 600 to 3500 gallons, and there are three to seven process solutions in each line. Approximately 7M gallons of water is being saved each year, resulting in a cost savings of $155K for purchase, treatment, discharge, maintenance, and energy (for heated tanks).
Because the Auburn, WA tanklines already had programmable timers installed on the tanks, no capital costs were incurred. Operators were trained to use the timers at crew meetings, where the phrase “press the button for every load” was heavily emphasized.
Signs are posted on the tanks to remind the operators to press the timer button each time a load is processed (figure 12). If the process is followed, the addition of water will be uniformly and efficiently managed.
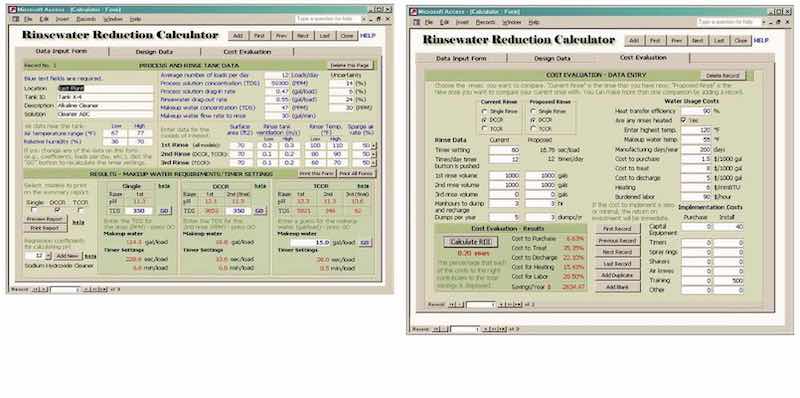 Figure 11. RRC Data Input Form for Sodium Hydroxide Cleaner; and Figure 12—Cost savings analysis form.
Summary
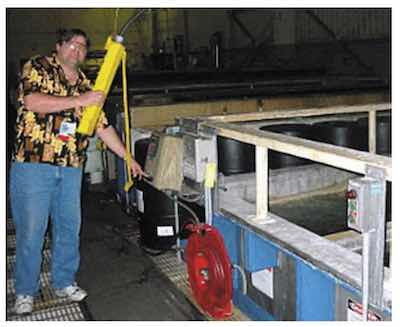 Figure 13. Operator presses timer button after lowering basket into second rinseFor any tankline rinsewater-reduction effort, the first task is to determine the volume of water required to maintain the levels and concentrations of the rinse tanks. This can be accomplished with the use of the RRC. The timer settings generated by the RRC are a starting point and might have to be adjusted either up or down after implementation.
The results generated by the RRC are only as accurate as the data used. The uncertainty analysis, which is only available for the single and DCCR designs, cushions the timer setting to ensure the specification requirements are met. In practice, there has only been one application where the timer setting had to be increased due to a TDS overshoot.
The RRC is available on the Boeing Company website at the following address: https://www.boeingsuppliers.com/environmental/RCC_Index.html
Acknowledgements
- Martin Chan - Boeing Chemical Process Manager
- Nancy Fleener - Boeing Chemical Materials & Processes Engineer Darren Sarver - Boeing Chemical Process Manager
- Paul Siebenaler - Boeing Chemical Process Engineer
- Alan Thompson - Boeing Chemical Engineer, Environmental Affairs Paul Thompson - Boeing Chemical Process Management Engineer Bert Vick - Boeing Chemist
References
- Laura Bloch, EPA Region 9, Product Finishing On-Line, “Reducing Rinse Water” February, 2000.
- William Barrett, PhD., P.E. & Paul Harten, PhD., US EPA, “Implementation of the US Environmental Protection Agency’s Metal Finishing Facility Pollution Prevention Tool (MFFP2T)”
- P. Gong, K.Q. Luo & Y.L. Huang, Plating and Surface Finishing, 84, 63 (November 1997).
- Intern Summary, “Technical Plating Saves Over $45,000 by Reducing Water and Sewer Costs”, MnTAP (Minnesota Technical Assistance Program), Minneapolis, MN 55455 (2003)
- J. Fullen, Proc. AESF SUR/FIN 2000, “Modeling for Rinse Water Reduction” (2000).
- A. Nagy, Product Finishing On-Line, “The Analysis and Design of Rinsing Installations”, July 2000.
- Turner, T., Aluminum Association Finishing Seminar, Detroit, Paper AN-2 (1968).
Julie Unangst holds a B.S. in Chemical Engineering from the University of Montana and did advanced work at the University of Colorado–Boulder. W. John Fullen, CEF holds a B.S. in Chemical Engineering from the University of Minnesota.